
Page 7 - Hillcroft Catalogue 2021 ebook
P. 7
Extra Doc % +13 +0 +0 +0 +0 +0 +0 +0 +0 +0 +0 +0 +0 +0 +0 +0 +0 +0 +0 +0 -5 HERITABILITIES OF TRAITS IN ANGUS
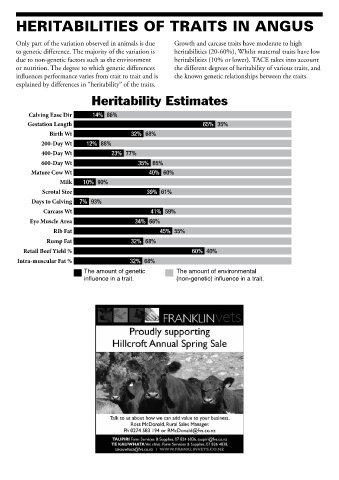
Only part of the variation observed in animals is due Growth and carcase traits have moderate to high
HDT +143 +133 +127 +123 +119 +116 +112 +109 +106 +103 +101 +98 +95 +92 +88 +85 +81 +76 +70 +61 +40 to genetic difference. The majority of the variation is heritabilities (20-60%), Whilst maternal traits have low
Indexes AP $ +213 +181 +166 +155 +146 +139 +132 +126 +119 +113 +106 +99 +92 +85 +78 +71 +62 +53 +43 +29 +7 due to non-genetic factors such as the environment heritabilities (10% or lower). TACE takes into account
or nutrition. The degree to which genetic differences
the different degrees of heritability of various traits, and
influences performance varies from trait to trait and is the known genetic relationships between the traits.
September 2021 TransTasman Angus Cattle Evaluation - Percentile Bands for all 2019 born animals
SR +169 +147 +137 +130 +126 +122 +118 +115 +111 +108 +105 +102 +99 +95 +92 +88 +83 +78 +72 +63 +40 explained by differences in “heritability” of the traits.
Heritability Estimates
IMF +3.7 +2.8 +2.4 +2.1 +1.9 +1.7 +1.5 +1.4 +1.2 +1.1 +0.9 +0.8 +0.7 +0.5 +0.4 +0.3 +0.1 +0.0 -0.2 -0.4 -0.9
% Calving Ease Dir 14% 86%
RBY +2.4 +1.7 +1.4 +1.2 +1.0 +0.8 +0.7 +0.6 +0.5 +0.4 +0.2 +0.1 +0.0 -0.1 -0.2 -0.3 -0.5 -0.7 -0.9 -1.3 -2.1 Gestation Length 65% 35%
Birth Wt 32% 68%
Use this table as a guide to compare individual animals with the current genetic level of the breed
200-Day Wt 12% 88%
+1.5
+1.3
+1.8
+2.7
+2.1
+1.1
+0.4
+0.2
+0.1
+0.9
+0.7
+0.6
+3.8
-0.5
-0.7
-0.1
-0.3
-1.9
-3.0
-1.0
-1.4
P8
Carcase mm 400-Day Wt 23% 77%
600-Day Wt
Rib +3.6 +2.5 +2.0 +1.7 +1.5 +1.3 +1.1 +0.9 +0.8 +0.6 +0.5 +0.3 +0.2 +0.0 -0.1 -0.3 -0.5 -0.7 -1.0 -1.4 -2.3 Mature Cow Wt 35% 65%
40% 60%
Milk
EMA sq.cm +11.3 +8.7 +7.4 +6.6 +6.0 +5.6 +5.2 +4.8 +4.5 +4.2 +3.9 +3.6 +3.3 +3.0 +2.7 +2.4 +2.0 +1.6 +1.1 +0.3 -1.4 Scrotal Size 10% 90% 39% 61%
Days to Calving 7% 93%
Cwt kg +79 +70 +66 +63 +60 +58 +56 +54 +53 +51 +49 +48 +46 +44 +42 +40 +38 +36 +33 +29 +18 Carcass Wt 41% 59%
Eye Muscle Area 34% 66%
DC days -8.7 -7.1 -6.2 -5.7 -5.3 -4.9 -4.6 -4.4 -4.1 -3.9 -3.6 -3.4 -3.2 -2.9 -2.7 -2.4 -2.1 -1.7 -1.2 -0.5 +1.5 Rib Fat 45% 55%
Fert Rump Fat 32% 68%
SS cm +4.0 +3.2 +2.8 +2.6 +2.4 +2.3 +2.2 +2.0 +1.9 +1.8 +1.7 +1.6 +1.5 +1.4 +1.3 +1.2 +1.0 +0.9 +0.6 +0.2 -0.8 Retail Beef Yield % 60% 40%
Intra-muscular Fat % 32% 68%
Milk +25 +22 +20 +19 +18 +17 +17 +16 +16 +15 +14 +14 +13 +13 +12 +11 +11 +10 +9 +7 +5
The amount of genetic The amount of environmental
influence in a trait. (non-genetic) influence in a trait.
Mwt +135 +120 +112 +108 +104 +101 +98 +95 +93 +90 +88 +85 +83 +80 +78 +75 +71 +67 +62 +55 +41
Growth 600 +139 +126 +120 +116 +112 +110 +107 +105 +103 +101 +99 +96 +94 +92 +90 +87 +85 +81 +77 +70 +59
kg
400 +105 +96 +91 +88 +86 +84 +82 +80 +79 +77 +76 +74 +73 +71 +70 +68 +66 +64 +61 +56 +46
200 +59 +54 +51 +49 +47 +46 +45 +44 +43 +42 +41 +40 +39 +38 +37 +36 +34 +33 +31 +28 +21
Bwt -0.2 +1.2 +1.8 +2.3 +2.7 +3.0 +3.2 +3.5 +3.7 +4.0 +4.2 +4.4 +4.6 +4.8 +5.0 +5.3 +5.6 +5.9 +6.3 +6.9 +8.0
Birth
GL days -9.6 -7.6 -6.7 -6.1 -5.6 -5.3 -5.0 -4.7 -4.4 -4.2 -4.0 -3.8 -3.6 -3.4 -3.1 -2.8 -2.5 -2.2 -1.6 -0.9 +0.9
Calv-Ease Dtrs % +9.0 +7.3 +6.2 +5.4 +4.7 +4.1 +3.5 +3.0 +2.5 +2.0 +1.5 +1.0 +0.4 -0.2 -0.8 -1.4 -2.2 -3.0 -4.1 -5.7 -8.8
Dir +10.8 +8.8 +7.6 +6.6 +5.8 +5.2 +4.5 +3.8 +3.2 +2.5 +1.9 +1.3 +0.6 -0.1 -0.8 -1.6 -2.5 -3.6 -5.0 -7.2 -12.1
High 1% High 5% High 10% High 15% High 20% High 25% High 30% High 35% High 40% High 45% 50% Low 45% Low 40% Low 35% Low 30% Low 25% Low 20% Low 15% Low 10% Low 5% Low 1%