
Page 7 - Ranui Catalogue 2021 ebook
P. 7
GRS +113 GRS Greater Profitability +149 +139 +134 +130 +127 +125 +123 +120 +119 +117 +115 +113 +111 +108 +106 +103 +100 +96 +91 +82 +32 Lower Profitability
Selection Indexes GRN DOM +122 +109 Selection Indexes GRN DOM Greater Greater Profitability Profitability +189 +139 +171 +131 +161 +126 +154 +123 +149 +121 +144 +119 +139 +117 +135 +115 +132 +11
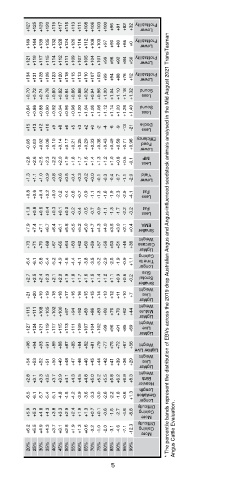
TransTasman Angus Cattle Evaluation - Mid August 2021 Reference Tables
ABI +116 ABI Greater Profitability +161 +149 +142 +138 +134 +131 +128 +126 +123 +120 +118 +115 +113 +110 +107 +103 +99 +94 +88 +76 +12 Lower Profitability
Structure Claw Angle +0.85 +0.98 Structure Claw Angle More More Sound Sound +0.42 +0.60 +0.54 +0.70 +0.62 +0.76 +0.66 +0.80 +0.70 +0.84 +0.72 +0.86 +0.74 +0.88 +0.78 +0.90 +0.80 +0.92 +0.82 +0
DOC +6 DOC More Docile +33 +24 +20 +17 +15 +13 +12 +10 +9 +8 +6 +5 +3 +2 +0 -2 -4 -6 -9 -13 -21 Less Docile
Other Other Efficiency Efficiency
NFI-F +0.18 NFI-F Feed Greater -0.56 -0.33 -0.22 -0.14 -0.08 -0.03 +0.02 +0.06 +0.10 +0.14 +0.17 +0.21 +0.25 +0.29 +0.33 +0.38 +0.43 +0.49 +0.58 +0.71 +0.96 Feed Lower
IMF +2.0 IMF IMF More +4.5 +3.7 +3.3 +3.0 +2.8 +2.6 +2.5 +2.3 +2.2 +2.0 +1.9 +1.8 +1.7 +1.6 +1.4 +1.3 +1.2 +1.0 +0.8 +0.5 -0.1 IMF Less
RBY +0.5 RBY Yield Higher +2.8 +2.1 +1.7 +1.5 +1.3 +1.1 +1.0 +0.9 +0.8 +0.6 +0.5 +0.4 +0.3 +0.2 +0.0 -0.1 -0.3 -0.4 -0.7 -1.1 -2.0 Yield Lower
Carcase P8 RIB -0.4 +0.0 Carcase P8 RIB Fat Fat More More +3.3 +3.4 +2.1 +2.2 +1.5 +1.6 +1.1 +1.3 +0.8 +1.0 +0.6 +0.8 +0.4 +0.6 +0.2 +0.4 +0.0 +0.3 -0.2 +0.1 -0.4 +0.0 -0.6 -0.2 -0.7 -0.
BREED AVERAGE EBVs EMA CWT DTC +6.0 +64 -4.6 * Breed average represents the average EBV of all 2019 drop Australian Angus and Angus-influenced seedstock animals analysed in the Mid August 2021 TransTasman Angus Cattle
Fertility
Milk SS +2.0 +17 Fertility SS Milk Live Size Larger Shorter Scrotal Weight Heavier +4.3 +28 +3.5 +24 +3.1 +23 +2.8 +22 +2.7 +21 +2.5 +20 +2.4 +19 +2.3 +19 +2.1 +18 +2.0 +18 +1.9 +17 +1.8
MCW +97 MCW Weight Mature Heavier +153 +134 +125 +119 +115 +111 +108 +105 +102 +100 +97 +94 +92 +89 +86 +83 +80 +76 +70 +62 +44 Weight Mature Lighter
Growth 600 +113 Growth 600 Live Weight Heavier +156 +142 +135 +130 +127 +124 +121 +119 +117 +115 +113 +111 +109 +107 +104 +102 +99 +96 +91 +85 +69 Live Weight Lighter
400 +87 400 Live Weight Heavier +116 +107 +102 +99 +96 +94 +93 +91 +89 +88 +87 +85 +84 +82 +81 +79 +77 +75 +72 +67 +56 Weight Lighter Live
200 +48 200 Live Weight Heavier +66 +60 +57 +56 +54 +53 +52 +51 +50 +49 +48 +47 +46 +46 +45 +44 +42 +41 +39 +36 +29 Live Weight Lighter
BW +4.1 BW Birth Weight +0.1 +1.4 +2.0 +2.5 +2.8 +3.1 +3.3 +3.5 +3.7 +3.9 +4.1 +4.3 +4.5 +4.8 +5.0 +5.2 +5.5 +5.8 +6.2 +6.9 +8.3 Birth Weight
Birth Birth Lighter Length Length Heavier
GL -4.5 GL Shorter Difficulty Gestation -10.5 -8.6 -7.6 -7.0 -6.5 -6.1 -5.7 -5.4 -5.1 -4.8 -4.5 -4.2 -3.9 -3.6 -3.3 -3.0 -2.6 -2.2 -1.6 -0.6 +1.3 Longer Difficulty Gestation
Calving Ease CEDtrs CEDir +2.5 +2.0 Calving Ease CEDtrs CEDir Less Calving Calving Difficulty +10.0 +11.1 +8.3 +9.1 +7.2 +7.9 +6.5 +7.0 +5.9 +6.2 +5.3 +5.5 +4.8 +4.9 +4.3 +4.3 +3.8 +3.7 +3.3 +3
Brd Avg Evaluation . % Band Less 1% 5% 10% 15% 20% 25% 30% 35% 40% 45% 50% 55% 60% 65% 70% 75% 80% 85% 90% 95% 99% More
5