
Page 13 - Atahua Angus Sale 2021 ebook
P. 13
Extra Doc % +32 +25 +20 +18 +16 +14 +12 +11 +9 +8 +6 +5 +3 +2 +0 -2 -4 -6 -9 -13 -21
HDT Index (heifer/dairy terminal)
HDT +145 +135 +129 +125 +122 +118 +115 +112 +109 +106 +104 +101 +98 +95 +92 +88 +84 +80 +74 +65 +44
New Zealand Angus Heifer/Dairy Terminal Index - Predicted Response
Indexes AP $ +214 +183 +168 +157 +148 +141 +134 +127 +120 +113 +105 +97 +89 +82 +74 +66 +57 +47 +35 +21 -2
SR +168 +146 +135 +129 +124 +119 +116 +112 +108 +105 +101 +97 +93 +90 +86 +81 +76 +70 +63 +54 +27
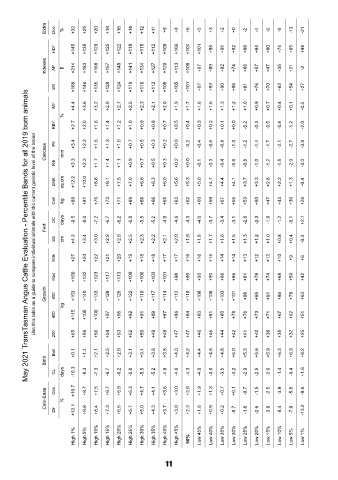
May 2021 TransTasman Angus Cattle Evaluation - Percentile Bands for all 2019 born animals
Expected Change in Individual Traits IMF RBY % +4.4 +2.7 +3.6 +2.0 +3.2 +1.6 +2.9 +1.4 +2.7 +1.2 +2.5 +1.0 +2.3 +0.9 +2.1 +0.8 +2.0 +0.7 +1.9 +0.5 +1.7 +0.4 +1.6 +0.3 +1.5 +0.2 +1.3 +0.1 +1.2 +0.0 +1.0 -0.2 +0.9 -0.3 +0.7 -0.5 +0.4 -0.8 +0.1 -1.2 -0.5 -2.0
Use this table as a guide to compare individual animals with the current genetic level of the breed
Carcase P8 mm +3.4 +2.2 +1.6 +1.3 +1.0 +0.7 +0.5 +0.3 +0.2 +0.0 -0.2 -0.4 -0.6 -0.8 -1.0 -1.2 -1.4 -1.7 -2.1 -2.7 -3.9
Rib +3.3 +2.2 +1.7 +1.4 +1.1 +0.9 +0.7 +0.5 +0.3 +0.2 +0.0 -0.1 -0.3 -0.4 -0.6 -0.8 -1.0 -1.2 -1.5 -2.0 -3.0
CEd CEm GL BW 200W 400W 600W MCW Milk SS DC Cwt EMA Rib Rump RBY IMF
EMA sq.cm +12.2 +10.0 +8.8 +8.1 +7.5 +7.0 +6.6 +6.3 +6.0 +5.6 +5.3 +5.0 +4.7 +4.4 +4.1 +3.7 +3.3 +2.8 +2.2 +1.3 -0.4
Above the 0 line (X axis) selects for more positive numbers and below the line selects for more negative numbers.
For some traits (e.g. growth), a positive response is desirable and for others (e.g. days to calving), a negative response is desirable.
Cwt kg +89 +81 +76 +73 +71 +69 +68 +66 +65 +63 +62 +60 +59 +57 +55 +53 +50 +47 +43 +36 +26
This index is primarily driven by getting live calves on the ground, and producing an early maturing prime animal with DC days -9.5 -8.0 -7.2 -6.7 -6.2 -5.8 -5.5 -5.2 -4.9 -4.6 -4.3 -4.0 -3.7 -3.4 -3.1 -2.8 -2.3 -1.9 -1.2 -0.1 +2.1
added carcase traits for improved carcase yield and marbling with no direct selection for maternal traits. Fert
SS cm +4.2 +3.4 +3.0 +2.8 +2.6 +2.5 +2.3 +2.2 +2.1 +2.0 +1.9 +1.8 +1.7 +1.6 +1.5 +1.3 +1.2 +1.0 +0.8 +0.4 -0.3
NB. It is important point to be aware that while no emphasis has been placed on some traits, for example
maternal traits in the HDT, they still may be selected for indirectly through positive or negative correlations with Milk +27 +24 +22 +21 +20 +19 +18 +18 +17 +17 +16 +16 +15 +14 +14 +13 +12 +12 +10 +9 +6
other traits, as is the case with Days to Calving in the HDT.
Mwt +150 +132 +123 +117 +113 +109 +106 +103 +101 +98 +95 +93 +90 +88 +85 +81 +78 +74 +68 +59 +42
Growth 600 +153 +140 +133 +128 +125 +122 +119 +117 +114 +112 +110 +108 +106 +103 +101 +98 +95 +91 +86 +78 +63
kg
400 +115 +105 +100 +97 +95 +92 +91 +89 +87 +86 +84 +83 +81 +80 +78 +76 +73 +71 +67 +62 +51
200 +65 +59 +56 +54 +53 +52 +50 +49 +48 +47 +47 +46 +45 +44 +42 +41 +40 +38 +35 +32 +25
Bwt +0.1 +1.4 +2.1 +2.5 +2.8 +3.1 +3.4 +3.6 +3.8 +4.0 +4.2 +4.4 +4.6 +4.8 +5.0 +5.3 +5.6 +5.9 +6.3 +6.9 +8.2
Birth
GL days -10.3 -8.3 -7.3 -6.7 -6.2 -5.8 -5.5 -5.2 -4.9 -4.6 -4.3 -4.0 -3.8 -3.5 -3.2 -2.9 -2.5 -2.0 -1.4 -0.4 +1.6
Calv-Ease Dtrs Dir % +10.7 +12.1 +8.7 +9.8 +7.5 +8.4 +6.7 +7.3 +5.9 +6.5 +5.3 +5.7 +4.7 +5.0 +4.1 +4.3 +3.6 +3.7 +3.0 +3.0 +2.5 +2.3 +1.9 +1.6 +1.3 +0.9 +0.7 +0.2 +0.1 -0.7 -0.7 -1.6 -1.5 -2.6 -2.5 -3.8 -3.9 -5.4 -5.8 -7.9 -9.6 -13.2
High 1% High 5% High 10% High 15% High 20% High 25% High 30% High 35% High 40% High 45% 50% Low 45% Low 40% Low 35% Low 30% Low 25% Low 20% Low 15% Low 10% Low 5% Low 1%
11