
Page 5 - Kia Toa Charolais Catalogue ebook
P. 5
calving indicates a shorter interval from bull-in date to calving and
therefore higher fertility.
Carcase Weight EBV (kg) is based on abattoir carcase records and
is an indicator of the genetic differences in carcase weight at the
standard age of 650 days.
Eye Muscle Area EBV (sq cm) is calculated from measurements
from live animal ultrasound scans and from abattoir carcase data,
adjusted to a standard 300 kg carcase. This EBV estimates genetic
differences in eye muscle area at the 12/13th rib site of a 300 kg
dressed carcase. More positive EBVs indicate better muscling on
animals. Sires with relatively higher EMA EBVs are expected to
produce better muscled and higher percentage yielding progeny at
the same carcase weight than will sires with lower EMA EBVs.
Rib Fat and Rump Fat EBVs (mm) are calculated from
measurements of subcutaneous fat depth at the 12/13 rib site
and the P8 rump site (from live animal ultrasound scans and
from abattoir carcases) and are adjusted to a standard 300 kg
carcase. These EBVs are indicators of the genetic differences in
fat distribution on a standard 300 kg carcase. Sires with low, or
negative, fat EBVs are expected to produce leaner progeny at any
particular carcase weight than will sires with higher EBVs.
Retail Beef Yield EBV (%) indicates genetic differences between
animals for retail yield percentage in a standard 300 kg carcase.
Sires with larger EBVs are expected to produce progeny with higher
yielding carcases.
Intramuscular Fat EBV (%) is an estimate of the genetic difference
in the percentage of intra-muscular fat at the 12/13th rib site in a
300kg carcase. Depending on market targets, larger more positive
values are generally more favourable.
Accuracy (%) is based on the amount of performance information
available on the animal and its close relatives - particularly the
number of progeny analysed. Accuracy is also based on the
heritability of the trait and the genetic correlations with other
recorded traits. Hence accuracy indicates the “confidence level” of
the EBV. Accuracy ranges from 0-99% and indicates the probability
of an EBV changing with the addition of more progeny data. The
magnitude of possible change decreases as accuracy increases.
Accuracy below 75% should be regarded as low, between 76-90%
as medium and above 90% as high.
An accuracy value is reported with every EBV.
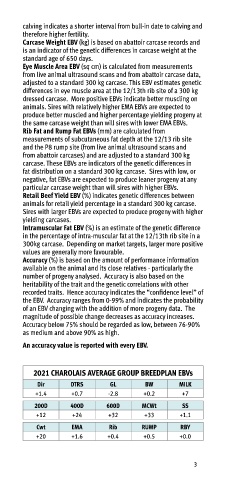
2021 CHAROLAIS AVERAGE GROUP BREEDPLAN EBVs
Dir DTRS GL BW MILK
+1.4 +0.7 -2.8 +0.2 +7
200D 400D 600D MCWt SS
+12 +24 +32 +33 +1.1
Cwt EMA Rib RUMP RBY
+20 +1.6 +0.4 +0.5 +0.0
2 3